
I’m looking to take data (numerical responses) from a google form and put the responses into an ongoing google sheet (have been able to do this easily). Then create a new tab on the google sheet with a bar graph representing the new data each time a form is submitted and email the bar graph as a pdf.

How do I automate Google Form data to Google Sheets, create a new tab with a bar graph, and email it as a PDF?
Userlevel 7
 +14
+14
- Certified Zapier Expert
- 24339 replies
-
26 April 2024

Hi
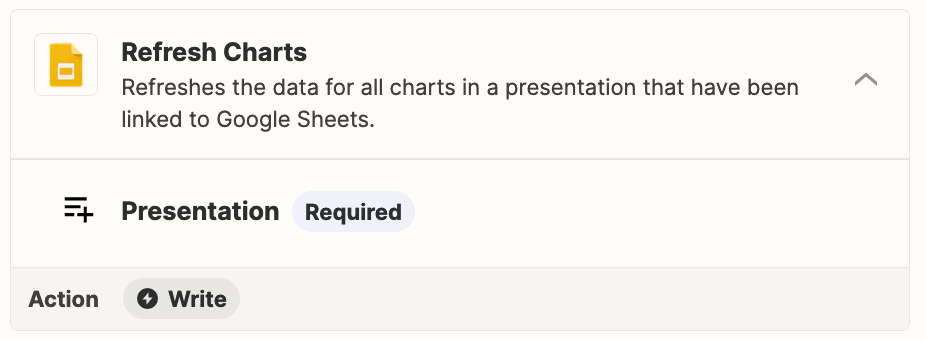
Try using GSlides.
Zap action: GSlides - Refresh Charts
https://zapier.com/apps/google-slides/integrations#triggers-and-actions
https://zapier.com/apps/google-slides/help
How to get the PDF version of GSlides.
- Beginner
- 2 replies
-
26 April 2024
The Google Slides tip seems great to help turn the Google Sheets graph into a PDF to email but I’m still struggling to find a path for the first part of the project.
Google Sheets creates a new row with responses from Google Form each time a new respondent submits the Form and adds a new line to Google Sheets with the new data (done).
Take the new row of data in Google Sheets and either remove the old values in the linked Graph and replace with values from the new line of data from the form
or (preferably)
Create a new tab on the Google Sheet for each new form response / submission with it’s own copy of the bar graph, representing the new set of data (and not containing any of the previous data) each time a form is submitted so that the respondent can see a chart of just their answers.
Then send it on to Google Slides to create a PDF to email out (done).
Any additional help is appreciated!
Reply
Enter your username or e-mail address. We'll send you an e-mail with instructions to reset your password.