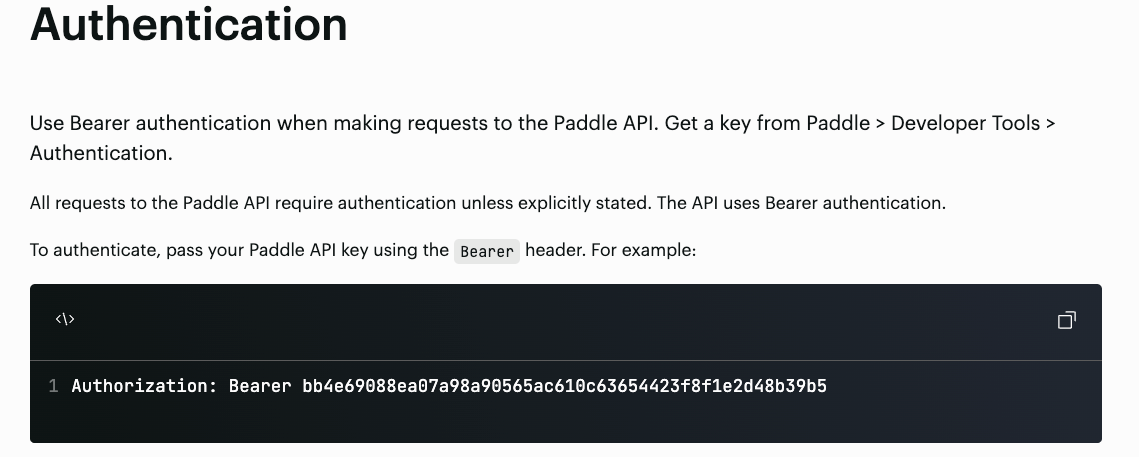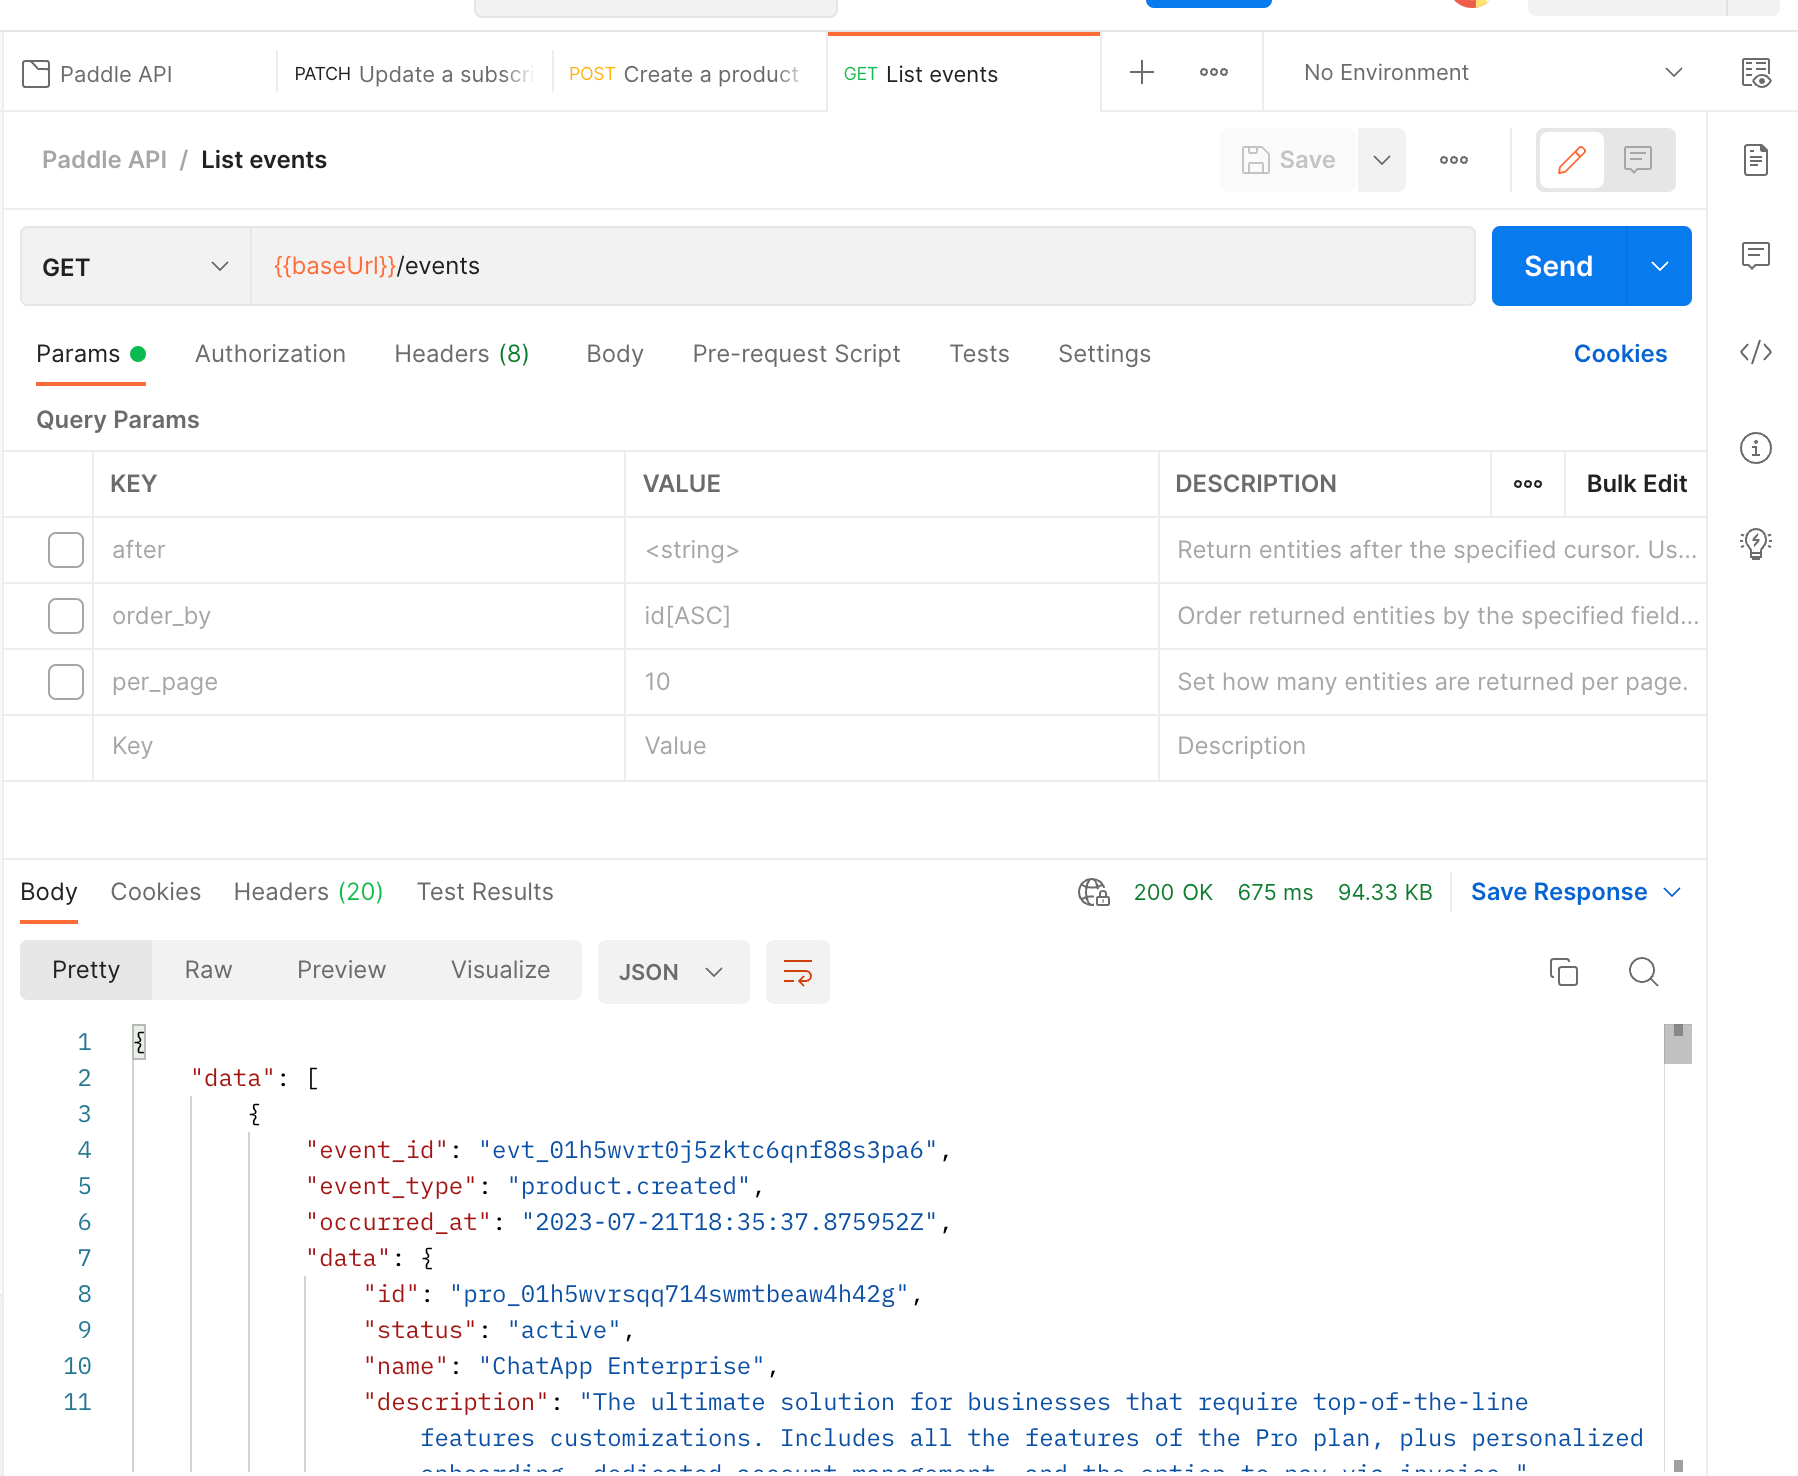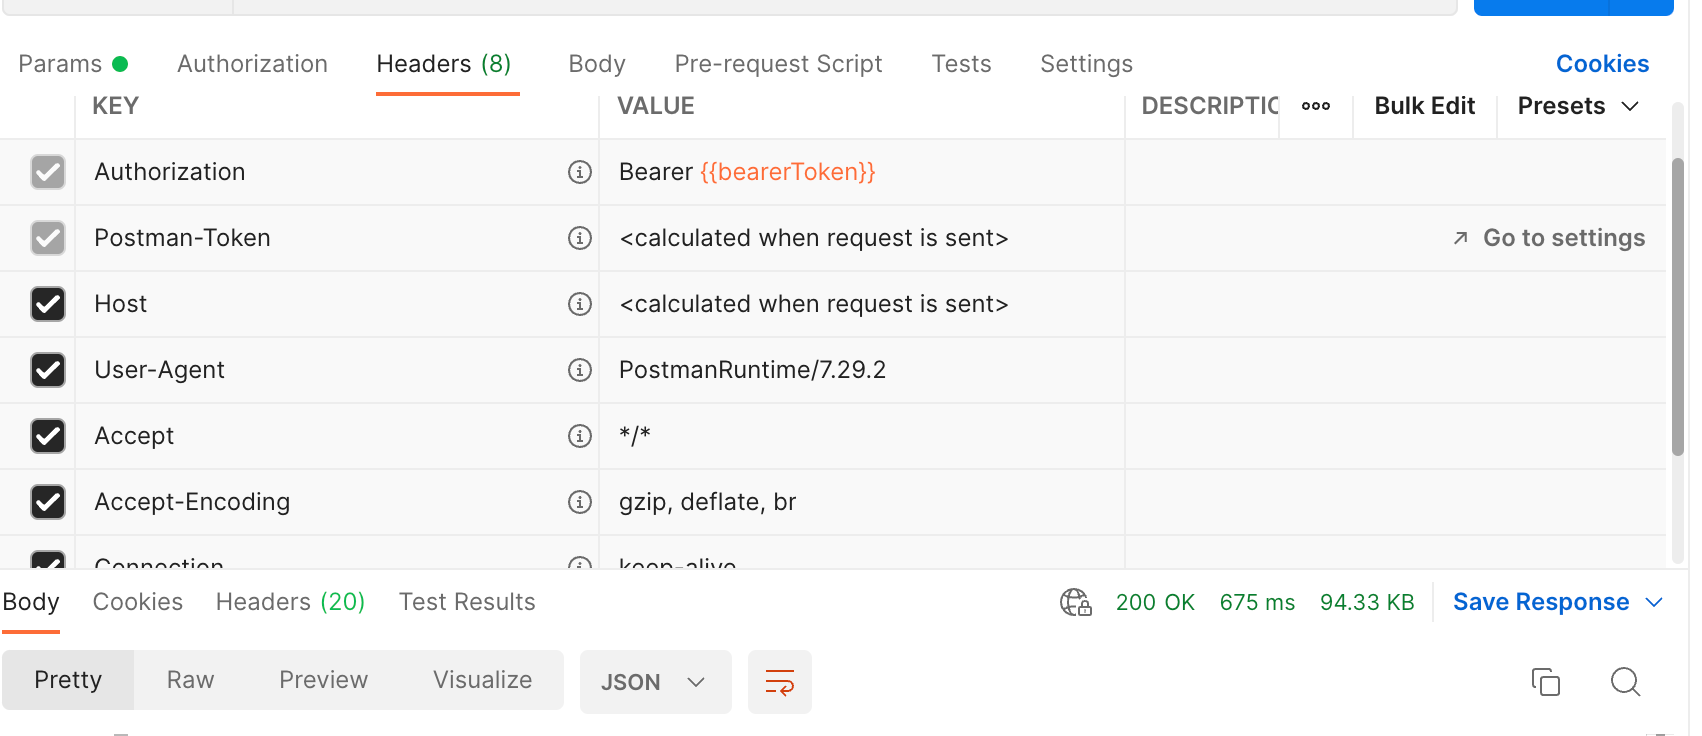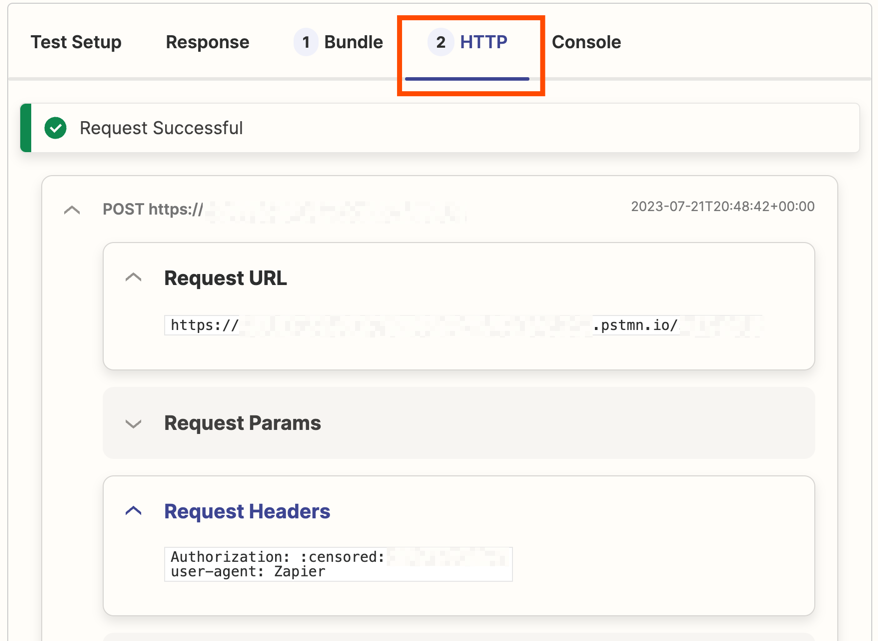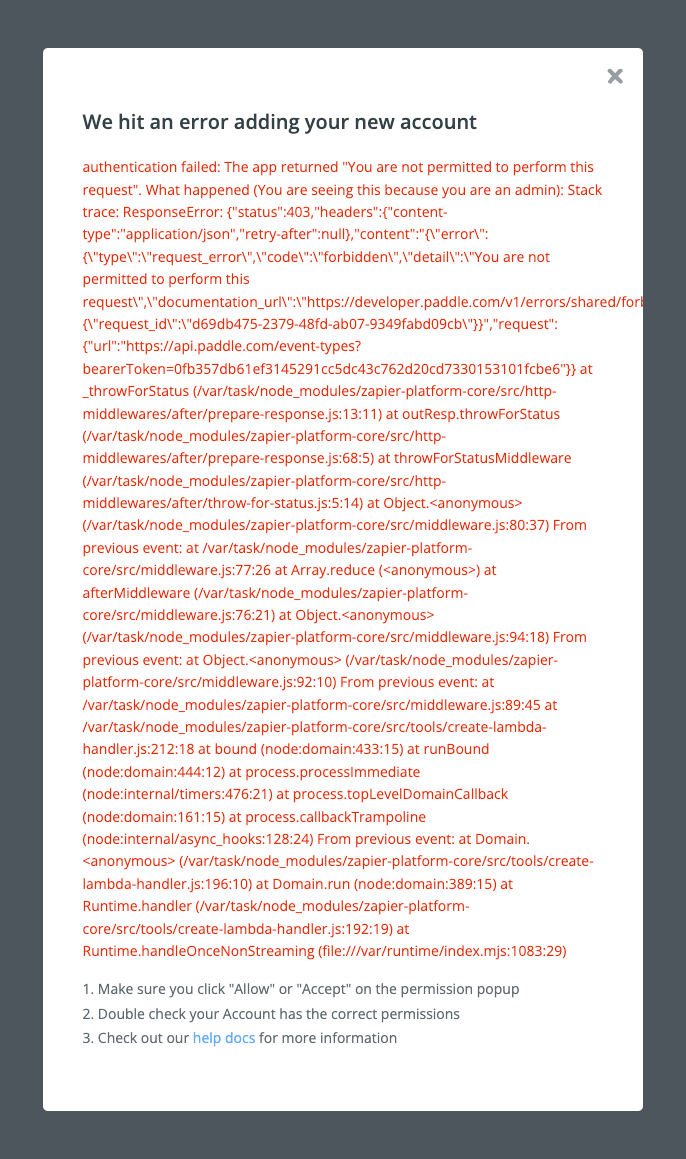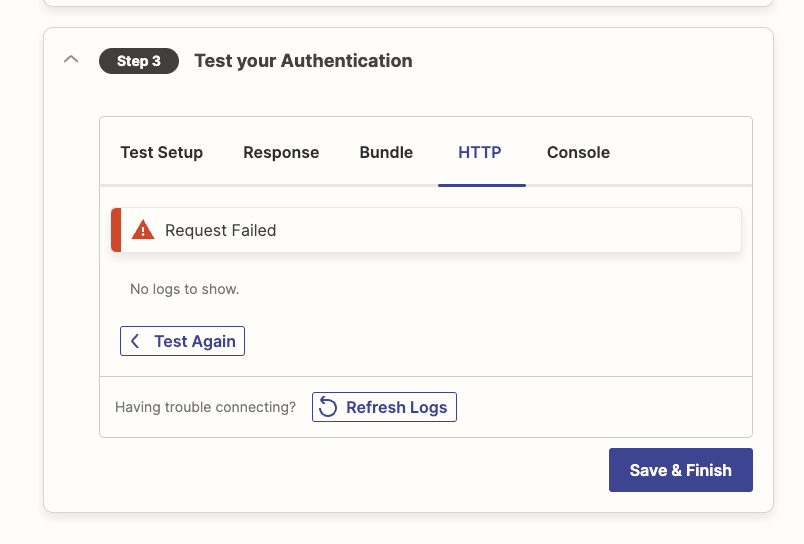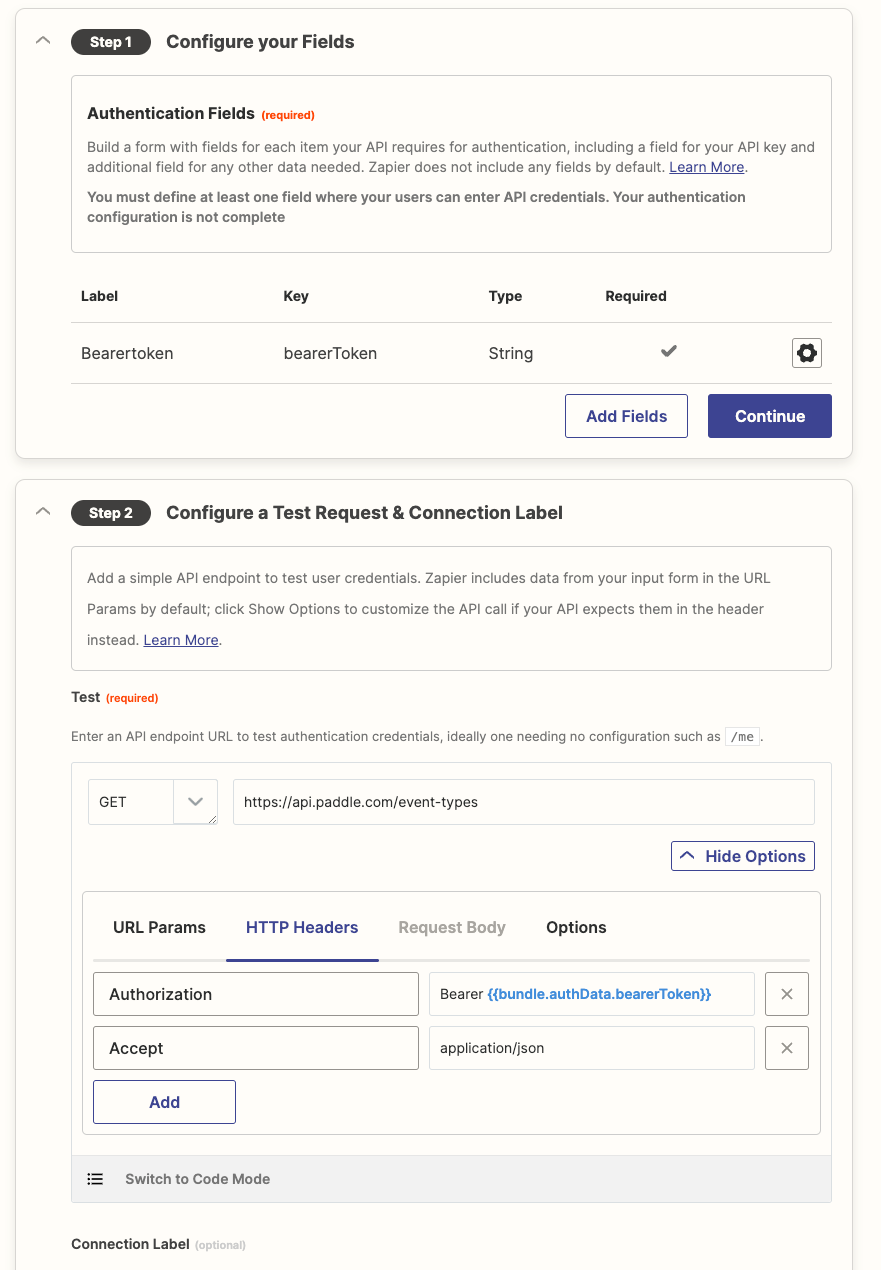
I am trying to test authentication of an app that uses a bearer Token for auth. When I input this as headers, they are not passed through to the request. See the error below. What am I doing wrong here?
Error:
authentication failed: The app returned "You are not permitted to perform this request". What happened (You are seeing this because you are an admin): Stack trace: ResponseError: {"status":403,"headers":{"content-type":"application/json","retry-after":null},"content":"{\"error\":{\"type\":\"request_error\",\"code\":\"forbidden\",\"detail\":\"You are not permitted to perform this request\",\"documentation_url\":\"https://developer.paddle.com/v1/errors/shared/forbidden\"},\"meta\":{\"request_id\":\"34ce0e94-4612-482c-b4fc-5dabf12f21de\"}}","request":{"url":"https://api.paddle.com/event-types"}} at _throwForStatus (/var/task/node_modules/zapier-platform-core/src/http-middlewares/after/prepare-response.js:13:11) at outResp.throwForStatus (/var/task/node_modules/zapier-platform-core/src/http-middlewares/after/prepare-response.js:68:5) at throwForStatusMiddleware (/var/task/node_modules/zapier-platform-core/src/http-middlewares/after/throw-for-status.js:5:14) at Object.<anonymous> (/var/task/node_modules/zapier-platform-core/src/middleware.js:80:37) From previous event: at /var/task/node_modules/zapier-platform-core/src/middleware.js:77:26 at Array.reduce (<anonymous>) at afterMiddleware (/var/task/node_modules/zapier-platform-core/src/middleware.js:76:21) at Object.<anonymous> (/var/task/node_modules/zapier-platform-core/src/middleware.js:94:18) From previous event: at Object.<anonymous> (/var/task/node_modules/zapier-platform-core/src/middleware.js:92:10) From previous event: at /var/task/node_modules/zapier-platform-core/src/middleware.js:89:45 at /var/task/node_modules/zapier-platform-core/src/tools/create-lambda-handler.js:212:18 at bound (node:domain:433:15) at runBound (node:domain:444:12) at process.processImmediate (node:internal/timers:476:21) at process.topLevelDomainCallback (node:domain:161:15) at process.callbackTrampoline (node:internal/async_hooks:128:24) From previous event: at Domain.<anonymous> (/var/task/node_modules/zapier-platform-core/src/tools/create-lambda-handler.js:196:10) at Domain.run (node:domain:389:15) at Runtime.handler (/var/task/node_modules/zapier-platform-core/src/tools/create-lambda-handler.js:192:19) at Runtime.handleOnceNonStreaming (file:///var/runtime/index.mjs:1083:29)


