Question

I have a problem with generating charts


I'm currently generating charts using QuickCharts, but they're not being generated in the correct format. I'm pulling data from Google Sheets in more than one row for daily reports where the Zap is triggered at the end of the day and fetches data in multiple rows.

Is there another method for generating charts where the image is generated in their respective places?

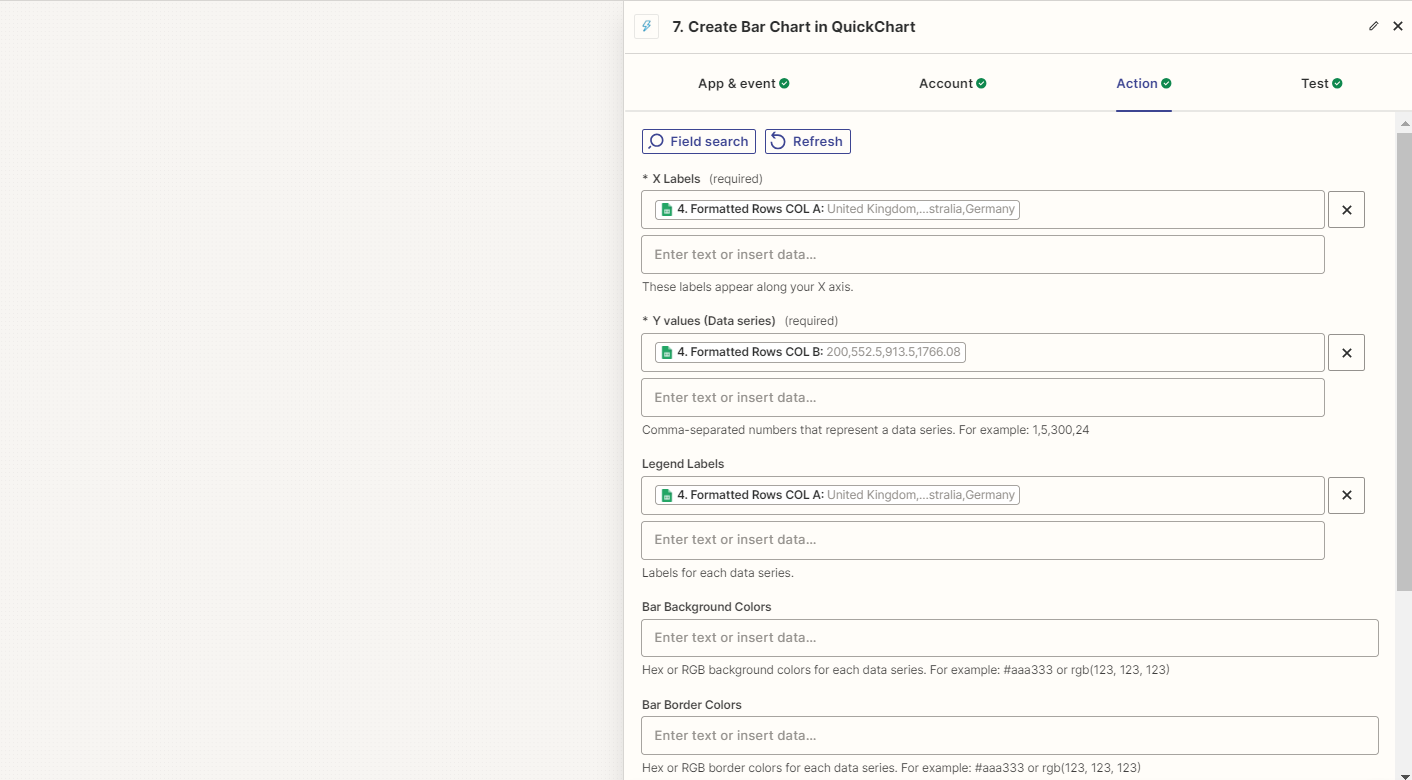
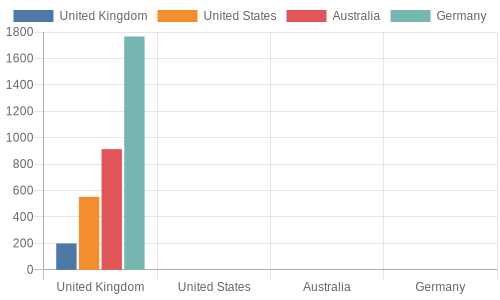
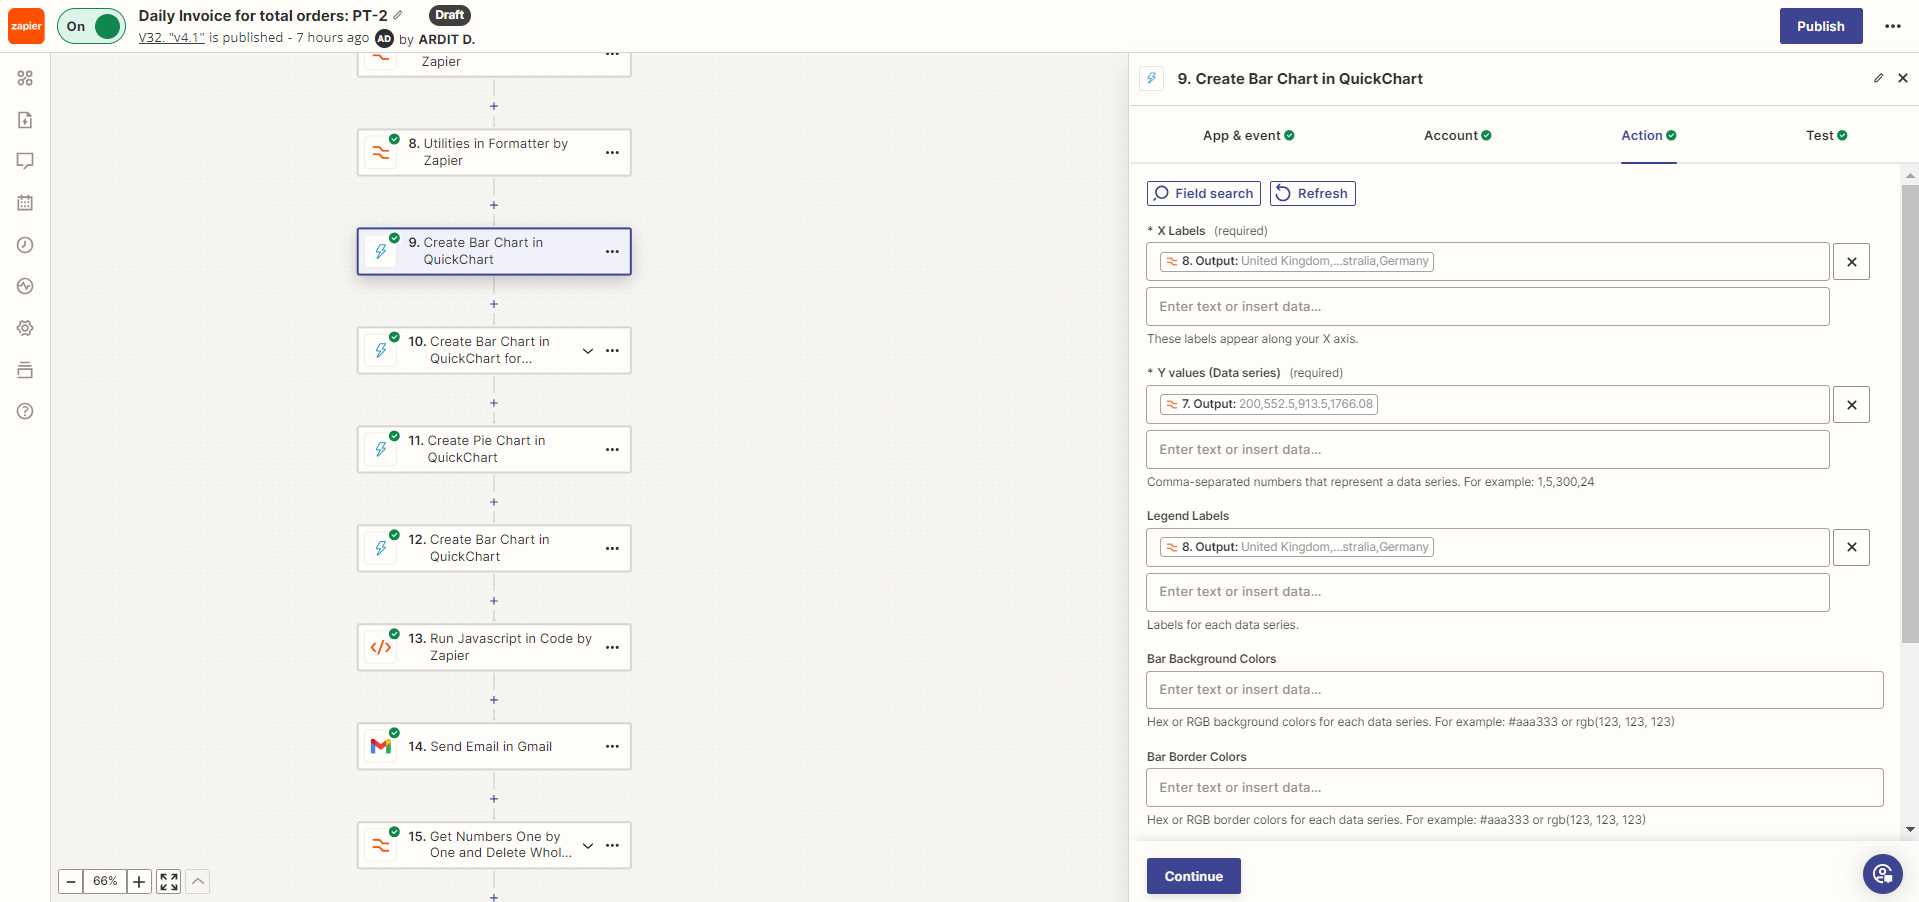
This is how I presented the data and the result is below. Please, could you show me how to retrieve data from Google Sheets so that charts can be generated correctly?


8 replies

Userlevel 6
Badge +6

Hey @Vullnet ,


Can you try below solution and than let me know if this works or not?


You will have to convert a text to line item. Search Formatter by Zapier → Utilites → Convert text to line item.

Add Google Sheet values in above formatter by zapier action.


Than use Formatter by Zapier values in Charts by QuickCharts

Hello @jayeshkumarbhatia,

This is not working; the response is the same as before. Is there any other alternative?

Could you please review the examples below


And this is response:


@jayeshkumarbhatia 

Could someone please assist me in resolving this issue?

Userlevel 6
Badge +6

Hey @Vullnet,

I don't see any issue with your Zap. 

I will suggest you to email Zapier Support or hire a Zapier Certified Expert. 

Hello @jayeshkumarbhatia,

The issue is that it's not placing bar charts in the right position up the respective names.

But above all, if you don't have any answer, I hope that support will assist me.


Userlevel 7
Badge +6

Hi there @Vullnet,

It looks like line items might not be supported that could be the reason why the data is not being placed in the right label. Could you please try adding a Formatter Line Item to Text function and map the output of the formatter on individual fields here:

eddf9c2e7e3b470e810f1afae77b3caa.png
(view larger)

Kindly give it a try and let me know how it goes? I'll keep an eye out for your response!

Hi there @ken.a,

No it doesn't work, I tried it.

But let me inform you that I found a glitch where I add ",0" to the y column and everything works fine.


Userlevel 7
Badge +6

Hi @Vullnet,

Thanks for giving that a try, and I’m sorry for the delayed response here.

I’d recommend reaching out to our Support Team regarding the issue you’re running into since they have the tools to look closer at the Zap and its logs.

You can reach our Support Team here: https://zapier.com/app/get-help

I appreciate your patience and understanding.


Reply