Question

How should I work with all this data?

  • 27 August 2023
  • 6 replies
  • 45 views

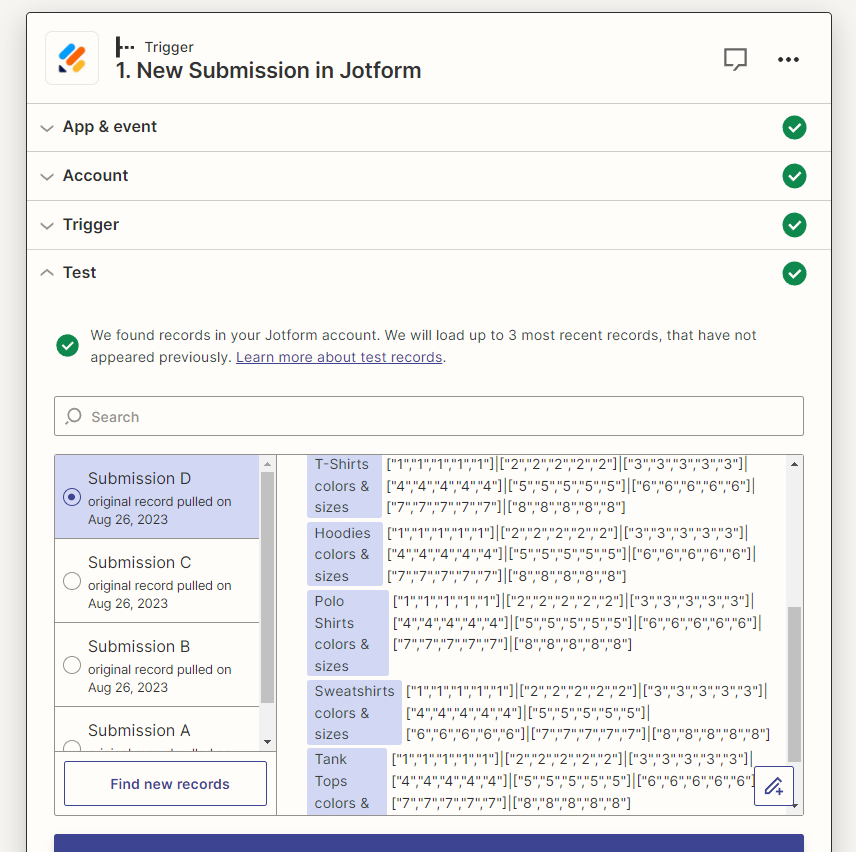
We have a Jotform collecting information from potential customers to get a quote. We have 5 different questions that are asked based on what apparel types the customer wants (T-Shirts, Hoodies, Polo Shirts, Sweatshirts, Tank Tops). Based on the answers they choose it will show them the colors & sizes chart for each to input their quantities. The screenshot shows data from 5 fields but we only need to know how to break down the data from 1 field, for example we can use the T-Shirts colors & sizes data which shows 5 of the same numbers repeating 8 times. With each of the same numbers representing the same colors. The order that the number is placed in the data is the sizes. So if the number is first that means it is extra small (XS), if it is last, number 5, it is extra large (XL). 

Now, the question: How do we format this data in Zapier so that we can have access to each individual data piece and be able to mark it with the size and color. We feel like this is a possible thing to do we just need guidance because we seem overwhelmed with even where to start at tackling this.


This post has been closed for comments. Please create a new post if you need help or have a question about this topic.

6 replies

As always, we greatly appreciate everyone’s help!

Userlevel 2
Badge +1

In these situations I find clarity on the desired output lets one back into the transformations required in order to get from here to there. I see some nods in that direction in your description, but it’s not quite clear to me (yet!) what you want to accomplish, so I can’t yet give focused advice. 

My general approach: I fall back to code steps when I deal with more complex manipulation in Zapier. Another option is an outbound webhook step to, say, Xano, which does transformation really well via the no-code stack. So that’s where I would look to manipulate your data to get the shape you need for your next set of business actions.


Hey Raydeck, thanks for taking the time to help us, I did see you mentioned that the formatting we we’re trying to do wasn’t clear.


This is the format that is currently in place, there is about 8 different sets with 5 values in each of them if the fill out ever size [“1”, 1”, “1”, “1”, “1”]. The ones represent the quantity and then the placement of the ones represent the sizes, so like this: [“Extra Small”, “Small”, “Medium”, “Large”, “Extra Large”]. Now that we cocered what the 5 values are (sizes) let’s go over what the 8 sets are for. So the 8 different sets represent all the colors with the placement of the set being White. Here is the set placement for the colors:


1-White

2-Black

3-Red

4-Blue

5-Orange

6-Purple

7-Yellow

8-Green

ChatGPT might have done a better job explaining it, lol: The current arrangement consists of 8 different groups, each comprising 5 values. These values are represented as ["1", "1", "1", "1", "1"], where the "1"s indicate quantity, and their positions correspond to sizes: ["Extra Small", "Small", "Medium", "Large", "Extra Large"]. Shifting our focus to the 8 sets, they are linked to specific colors: Set 1 is associated with White, Set 2 with Black, Set 3 with Red, Set 4 with Blue, Set 5 with Orange, Set 6 with Purple, Set 7 with Yellow, and finally, Set 8 with Green.

Userlevel 7
Badge +14

Hi @joesparks28 

It’s likely a Code step would have to be used to parse and prep the data.

Userlevel 2
Badge +1

So every group is a type (“t-shirt”) and within each group is 40 (5 sizes x 8 colors) combinations of size and color?  5 groups are visible in the view) So across all of your groups you have, say, 200 combinations (e.g. x-small purple t-shirt)? 

Turning this into those 200 or so data points with consistent names is relatively straightforward using a code step as Troy points out. But how you want them broken up would depend on what you plan to do with the data. Is there a single system that wants to ingest them? Are you looping over them in Zapier? etc.