Best answer

How do I update a spreadsheet tracking blog articles with data from GA4?

  • 4 December 2023
  • 3 replies
  • 59 views

I have a Google Spreadsheet that tracks published blog articles, with the goal to track when to close out or updated material over time. Each row contains the original publish date, article title, and URL.

I’d like to set up a Zap that runs periodically (i.e., the first of each month at 5am) to update each row with that page’s views over the last 30 days, and the last 365 days—pulling from Google Analytics 4.

I’m having trouble figuring out how to pull the exact metric needed to update that specific row.


Example of the spreadsheet:


Right now, I have—

Trigger: Every 1st day of the moth at 5am

Format dates for report run: -30 days, -1 day
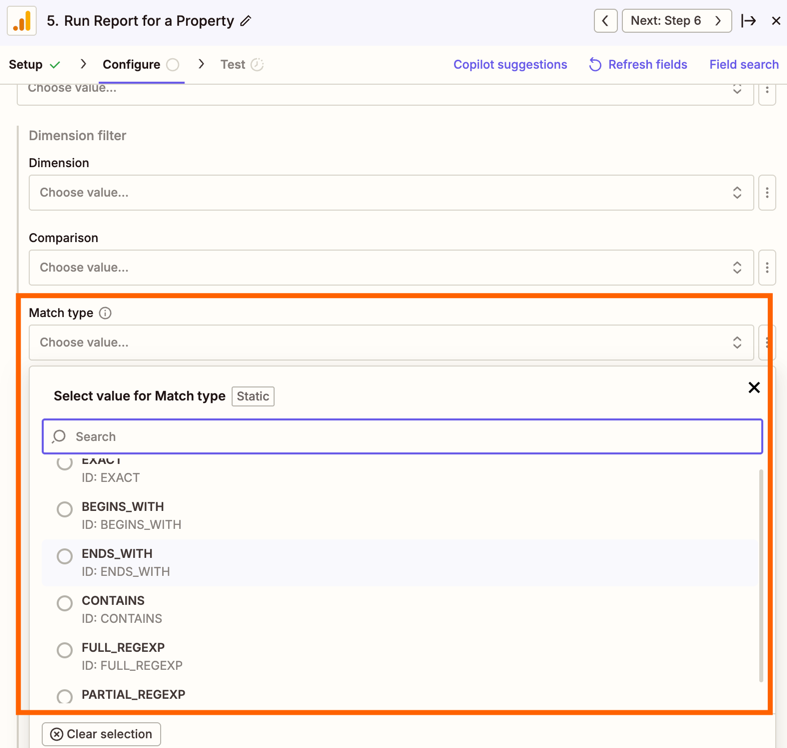
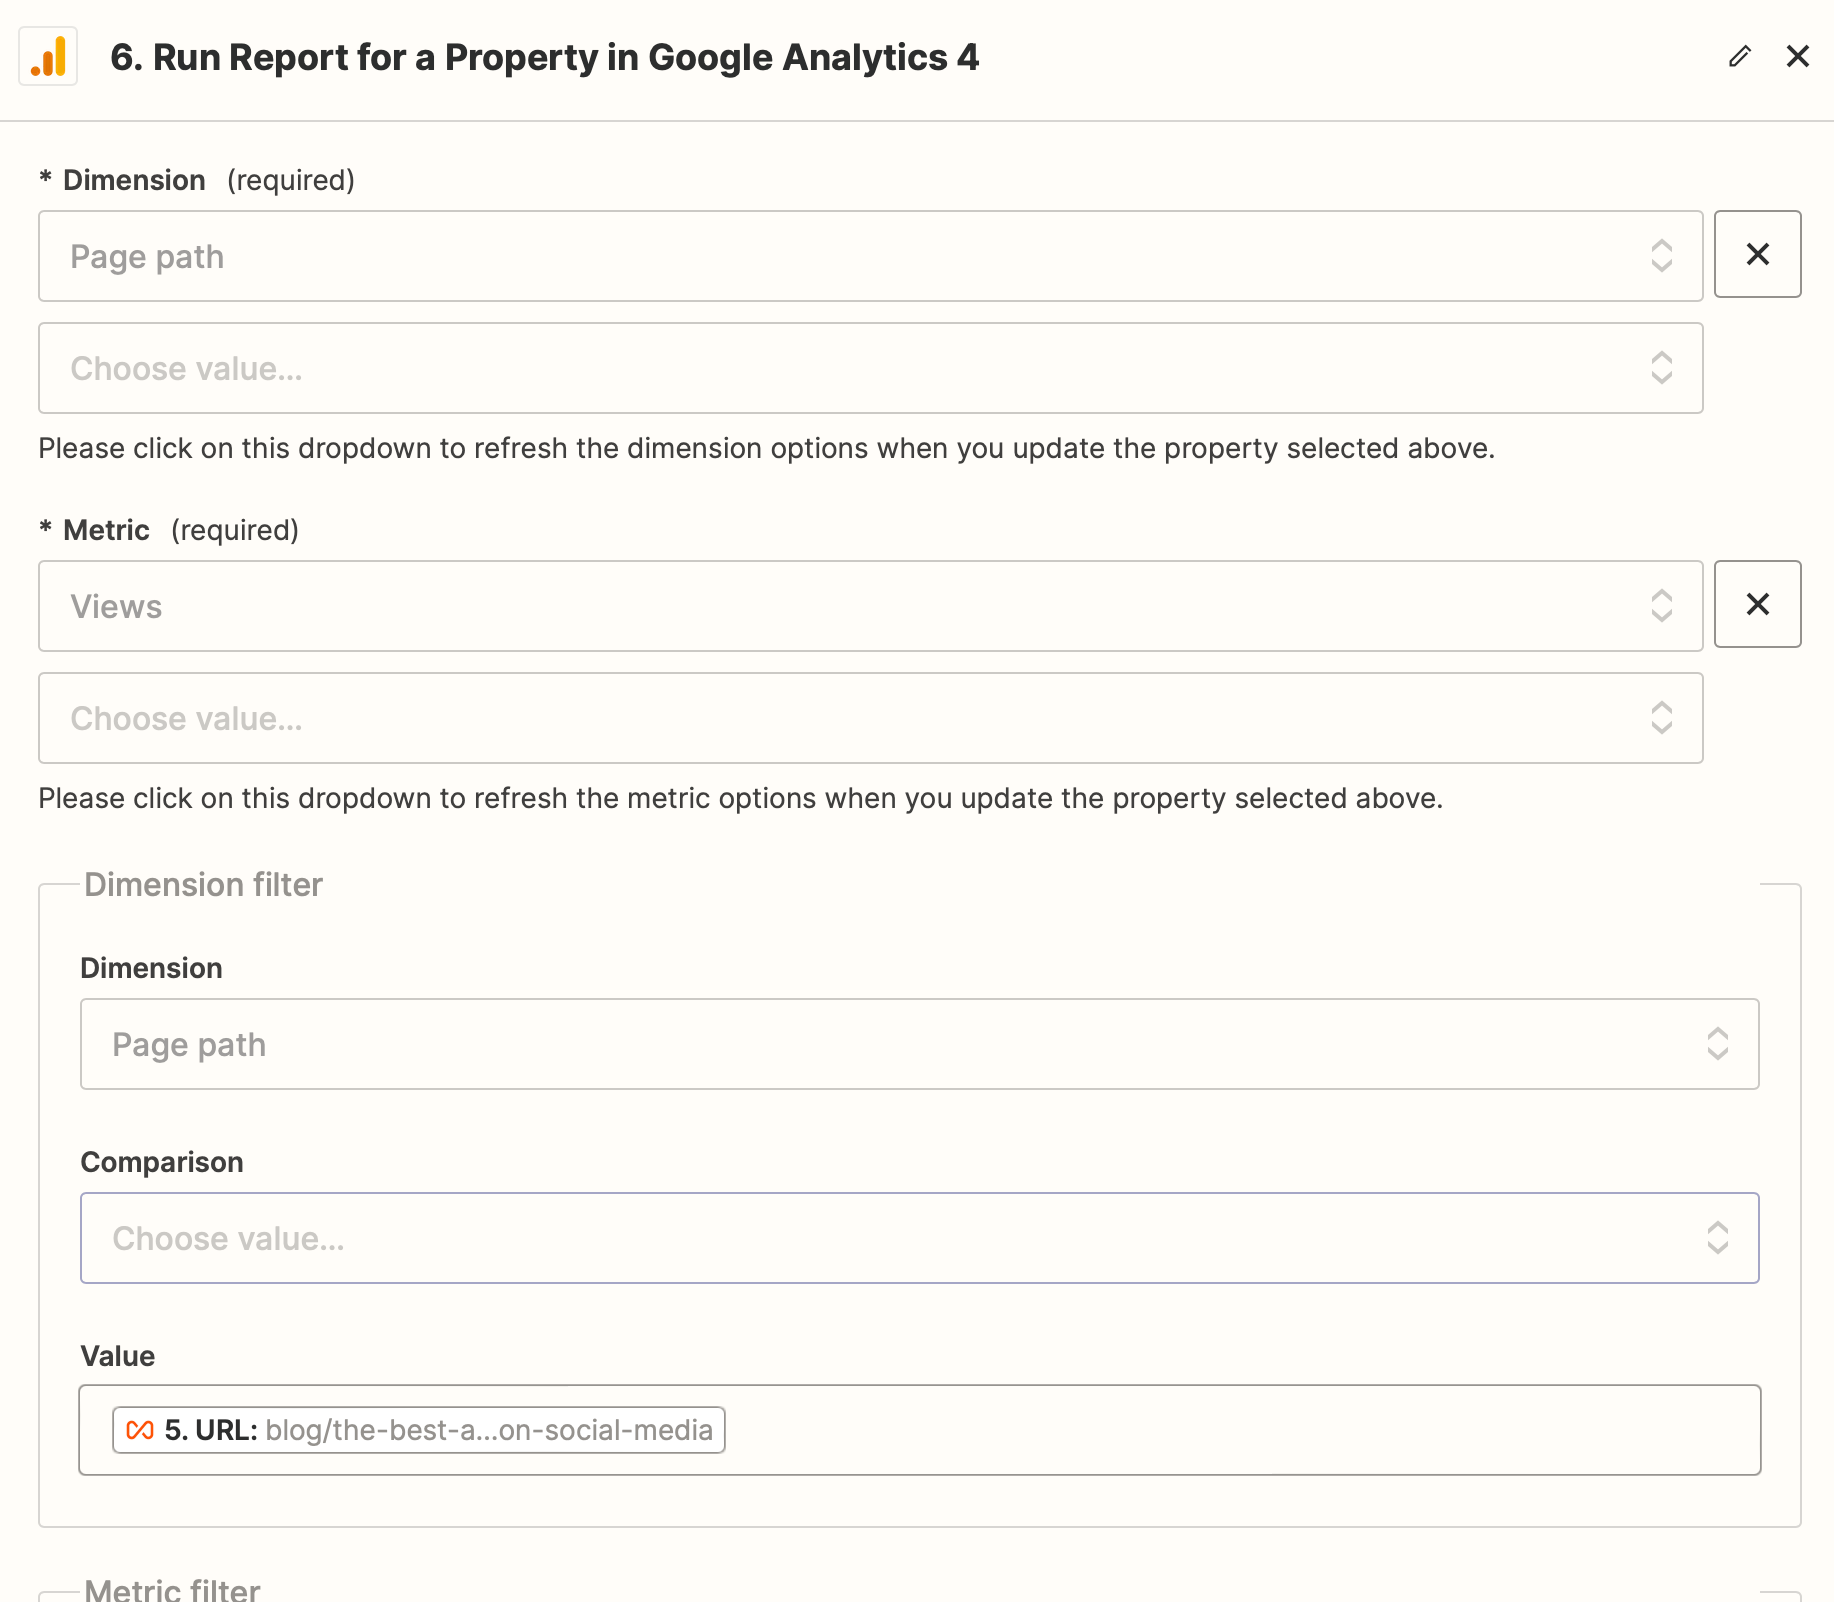
Run Report in GA4… 

But I’m stuck there. How do I get it to pull a metric for an individual page URL from a spreadsheet?


icon

Best answer by SamB 5 December 2023, 14:16

View original

3 replies

Userlevel 7
Badge +11

Hi @bhaley, welcome to the Community! 👋

In order to get the individual metric values from the spreadsheet you could try using the Google Sheets Get Many Spreadsheet Rows (Advanced, output as Line Items) action. That should return the data for each row as separate line items. Not sure how many rows are going to be in the spreadsheet but the Get Many Spreadsheet Rows action is limited to pulling a maximum of 500 rows so this may not be an ideal solution.

If you need to run a separate report for each page then you can put the Run Report for a Property action inside a loop. Using Looping by Zapier would allow you to then run a report for each of the pages separately. And you can use a Update Spreadsheet Row action in the loop that then adds the information from the report into the relevant spreadsheet row. If you’ve not used loops in a Zap before you can find out more about how to set them up here: Loop your Zap actions

Hope that helps. If I’ve misunderstood things here or you run into any issues do let us know!

Thanks @SamB - this was the suggestion I needed!

I’ve got it almost figured out. But I’m having trouble getting the Run Report for a Property action to run a report filtered down to the Looping line item. I’m using “Page Path” as the primary dimension and “Views” as the metric. Running a report like this does return the right metric, so I know I’m on the right track.

But when I add a dimension filter (as I would if creating the report manually in GA4), it doesn’t return the right results. For example, Dimension Filter: Dimension—Page path; comparison—blank; Value—Lopping Item Value doesn’t seem to filter the results at all. But when I add any comparison value, it returns either an error or no metrics.

Any suggestions?


Userlevel 7
Badge +11

Glad I could help @bhaley! 🤗

Ah, that’s similar to this one that was posted about in Community a while back:

As it sounds very much like what you’re trying to do here I’ve added your vote to the feature request (to have additional filtering options to the Comparison field), that the Support team added them to. Can’t make any promises around when or if that feature request will definitely implemented but we’ll send you an email notification as soon as it is! 

There was a potential workaround I suggested in that other topic, that I’ll share the details of here in case it’s helpful:

In the meantime, the Google Analytics 4 has an API Request (Beta) action available which you might be able to use to generate the report instead. It’s a bit more advanced than setting up the other Google actions but thought it worth mentioning here in case that’s something you’d want to explore. If you’re interested in giving that action a try you’ll want to reference the following guides when setting it up:


I do hope that helps to get you unstuck on this. I’ve not tested this out myself so please let us know whether you’re able to get it working!

Reply