Hey guys!

I am trying to find a way to automatically create/add a chart on google slides from a newly updated google sheet. Below is my zap flow :

  • Step 1 : CRM Hook - Trigger : When a new prospect comes in
  • Step 2 : Create a new spreadsheet from template
  • Step 3 : Update spreadsheet row with content from CRM
  • Step 4 : Create presentation (google slide) from template

I am trying to add the chart from the spreadsheet onto the slide. I can’t seem to find an option to do so? Anyone help please?

*If I can insert a chart on a slide and be able to change the source of this chart via zapier so it will reflect updated numbers, that could also work.


Hello @Limbic 

There is no such action step for adding the chart of Google Sheet into a Google Slide.However,a workaround you can definitely try is 

1.Create the Google Slide Template with the chart as Google Sheet as the source.This way Google Slide Chart will be connected to the data from Google Sheet.

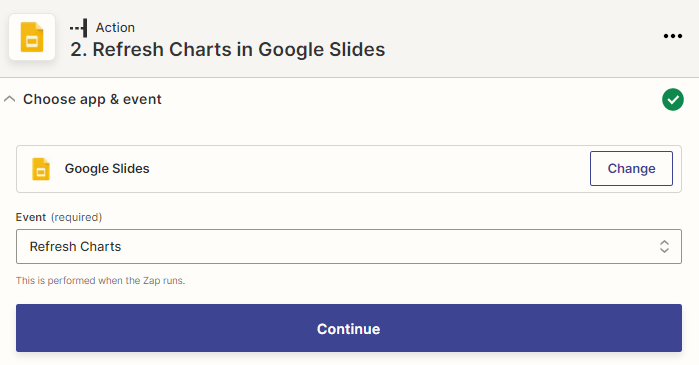
2.As you are updating the data in google sheet rows through zapier you have to refresh the data inside charts and there is an action step available for Google Slide called Refresh Charts

3.Then you can obviously use the next action step as Create Presentation from Template in Google Slides and use a Send Email using a Gmail app pulling the newly created presentation

You can refer to the screenshots attached below.


Hi @Limbic 

Good question.

Have you reviewed this help article for using GSlides in Zaps?

https://zapier.com/help/doc/how-use-set-google-slides-presentation-action


Tip: to pass images onto the template, you just need to create a text placeholder variable on your presentation template, then pass on a URL to a hosted image on your Zap template.


Hi @Limbic 

Good question.

Have you reviewed this help article for using GSlides in Zaps?

https://zapier.com/help/doc/how-use-set-google-slides-presentation-action


Tip: to pass images onto the template, you just need to create a text placeholder variable on your presentation template, then pass on a URL to a hosted image on your Zap template.

Hi Troy. Thanks for sharing but yes I’ve reviewed it. I already created different zaps in the past involving sheets and slides. But this time it’s a unique scenario.

The flow is a new sheet is created via a template when someone signs up from a form. That new sheet is auto populated with the info entered on the form. This sheet

Then a new presentation is then created from a template and auto populated by the info on the sheet. The reason why I need a sheet first rather than directly getting info from the form, is because I created a scorecard on the sheet that calculates the rating that populates a spider chart. 

Now that scorcard chart needs to be entered on the slides either as a static “image” or static chart that will be sent to the lead who signed up. So essentially it’s a formulated report.

All other variables are mapped, tested, and working, except for the chart. I can’t find a step/placeholder to be able to insert that chart.


Hello @Limbic 

There is no such action step for adding the chart of Google Sheet into a Google Slide.However,a workaround you can definitely try is 

1.Create the Google Slide Template with the chart as Google Sheet as the source.This way Google Slide Chart will be connected to the data from Google Sheet.

2.As you are updating the data in google sheet rows through zapier you have to refresh the data inside charts and there is an action step available for Google Slide called Refresh Charts

3.Then you can obviously use the next action step as Create Presentation from Template in Google Slides and use a Send Email using a Gmail app pulling the newly created presentation

You can refer to the screenshots attached below.


Hi Satya,


The flow is a new sheet is created via a template when someone signs up from a form. That new sheet is auto populated with the info entered on the form. This sheet

Then a new presentation is then created from a template and auto populated by the info on the sheet. The reason why I need a sheet first rather than directly getting info from the form, is because I created a scorecard on the sheet that calculates the rating that populates a spider chart. 

Now that scorcard chart needs to be entered on the slides either as a static “image” or static chart that will be sent to the lead who signed up. So essentially it’s a formulated report.

All other variables are mapped, tested, and working, except for the chart. I can’t find a step/placeholder to be able to insert that chart. So you see, the chart source is dynamic. Even if there’s a chart on the slides template, it still needs to be linked to the newly created sheet.

I’m happy to pay for someone to get this specific problem resolved.


Hi @Limbic!

I can’t think of a way to do exactly what you’re trying to do, but I might have a workaround. What if you add the user information to 2 different spreadsheets. One that will be the permanent sheet for that lead and one that you use only for the presentation and re-use for each lead. 

So your Zap would look like this:

  • Step 1 : CRM Hook - Trigger : When a new prospect comes in
  • Step 2 : Create a new spreadsheet from template
  • Step 3 : Update spreadsheet row with content from CRM
  • Step 4: Update existing spreadsheet that is linked to the template
  • Step 5 : Create presentation (google slide) from template

For each new lead, the dedicated ‘presentation’ sheet is update and used to populate the chart. Depending on how that works, you may need to add a step to Refresh the chart using the action that @Satya09 described. 


Would that work for how you have things set up, do you think?