
Currently the answers for the involve.me questions are text, looking for a way to convert it to number data. Total 17 categories, where 11 categories is the sum of 3 specific qns and 6 categories with single qns. the number data will be used in the next action for quickchart.

How to synthesis data from involve.me submission into number data for QuickChart?
This post has been closed for comments. Please create a new post if you need help or have a question about this topic.
Userlevel 7
 +6
+6
- Zapier Staff
- 3982 replies
-
7 June 2023

Hi there
Welcome to the Community! 🎉
I understand that you're looking to convert text responses from involve.me into numerical data, which will then be used in Quickchart. To assist you better, I need a bit more information:
Could you please provide more details about the 17 categories? What kind of questions are included in these categories? For the 11 categories that are the sum of 3 specific questions, could you clarify how you want to convert the text responses into numerical data?
Similarly, for the 6 categories with single questions, how do you plan to convert these text responses into numbers? Could you also elaborate on how you plan to use this numerical data in Quickchart?
Please keep us posted! 😊
- Beginner
- 2 replies
-
8 June 2023
Hi! Thank you for the response!
For the 11 categories, The questions have the same 4 answers:
Yes, we fully apply this principle = 3 points
Yes, and there's plenty of room for improvement = 2 points
No = 1 point
Our actions are degenerative = 0 points
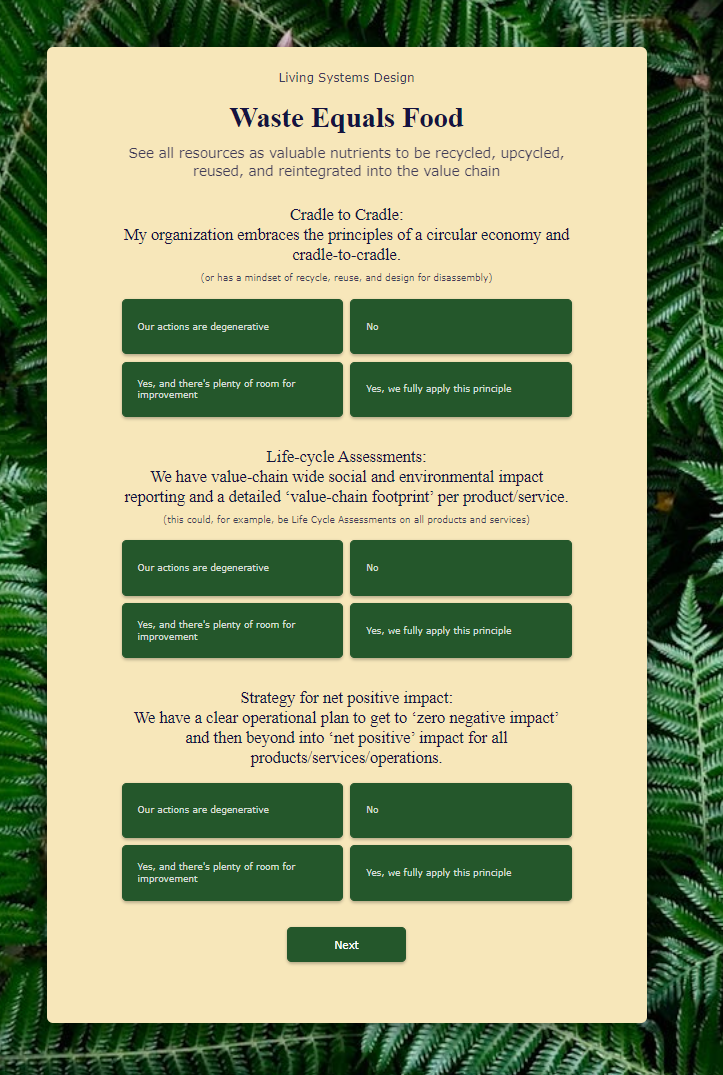
For the 6 categories with single questions, The questions have the same 4 answers:
Yes, we fully apply this principle = 6 points
Yes, and there's plenty of room for improvement = 4 points
No = 2 point
Our actions are degenerative = 0 points

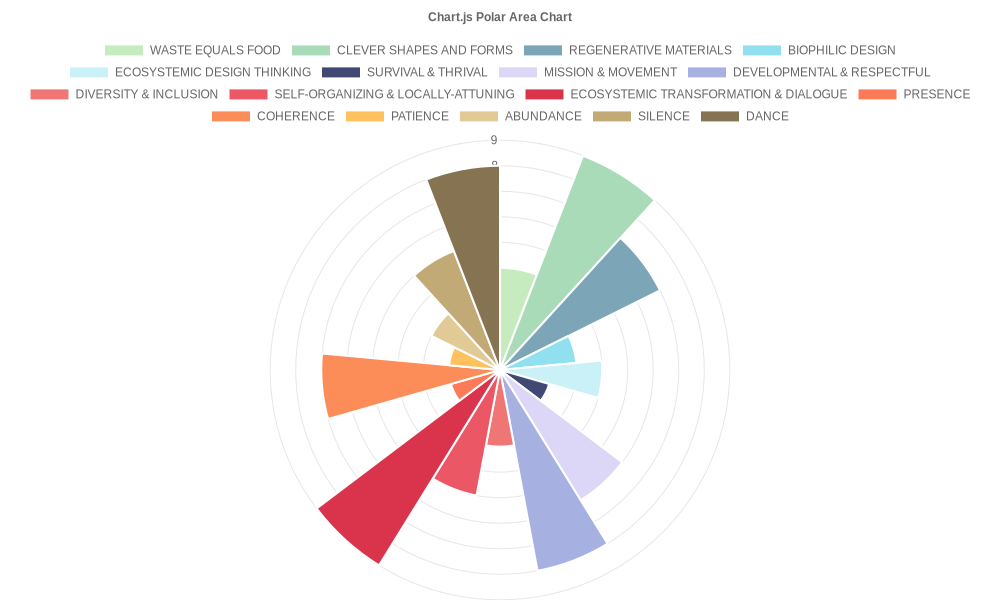
The points for the all categories are Maximum of 9 points.
For the 11 categories, it would the sum of points from the 3 questions.
For the 6 categories with single questions, it will be the individual questions points.
This is a sense how the results from Quick chart will look like.

Userlevel 7
+11
- Community Manager
- 4577 replies
-
8 June 2023

Hi
Looking at the helptext for a QuickChart Create Pie Chart action it needs you to supply a “Comma-separated numbers with each number representing a pie slice” then supply the labels for each pie slice in a separate field.
How does the data for involve.me submissions look in the Zap? Specifically do we get a series of separate question fields with the name of the selected answer or do they have an ID number or point value instead? If you could share a screenshot of the test sample from Involve.me trigger showing how what values we receive for the question fields that would be much appreciated.
It may be that you’ll need to use a Formatter (Utilities > Lookup Table) action to convert the value for each question field that’s received into the corresponding point value so you can supply that to the QuickChart action. But I’d like to see how those question fields are being sent over to be sure. Please remember to remove or hide any private information from it first (like names, email addresses etc.).
Looking forward to hearing from you!
- Beginner
- 2 replies
-
9 June 2023
Userlevel 7
+11
- Community Manager
- 4577 replies
-
12 June 2023
Thanks for sending those screenshots over,
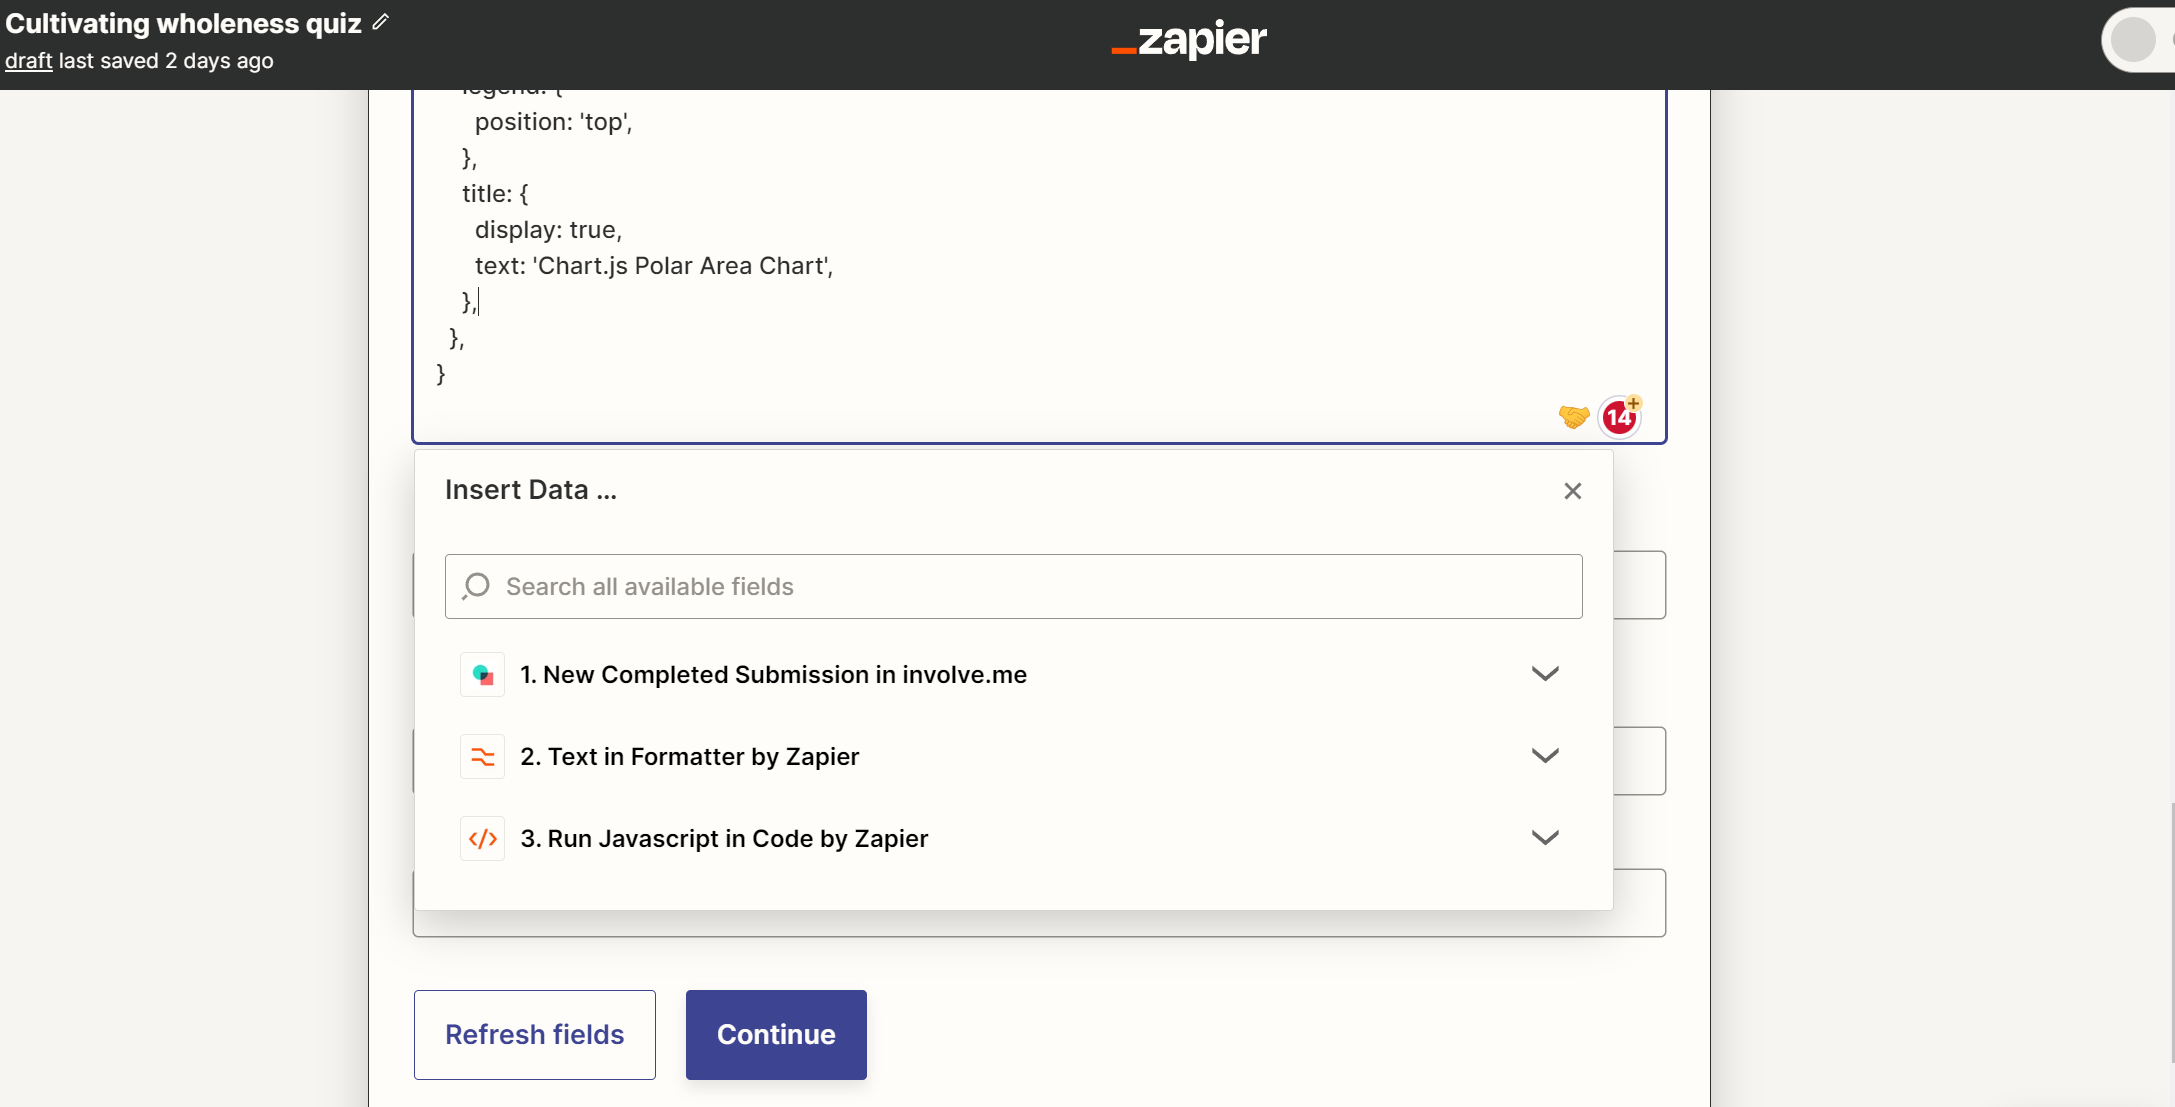
It’s still a little hard to see how the question fields are coming over, it looks like you might be getting the name of the answer that’s been selected e.g. “No” instead of the point value. Is that correct? If so, I also noticed a Run Javascript Code action in the Zap. Is that assigning a value based on the answer that’s selected for each question?
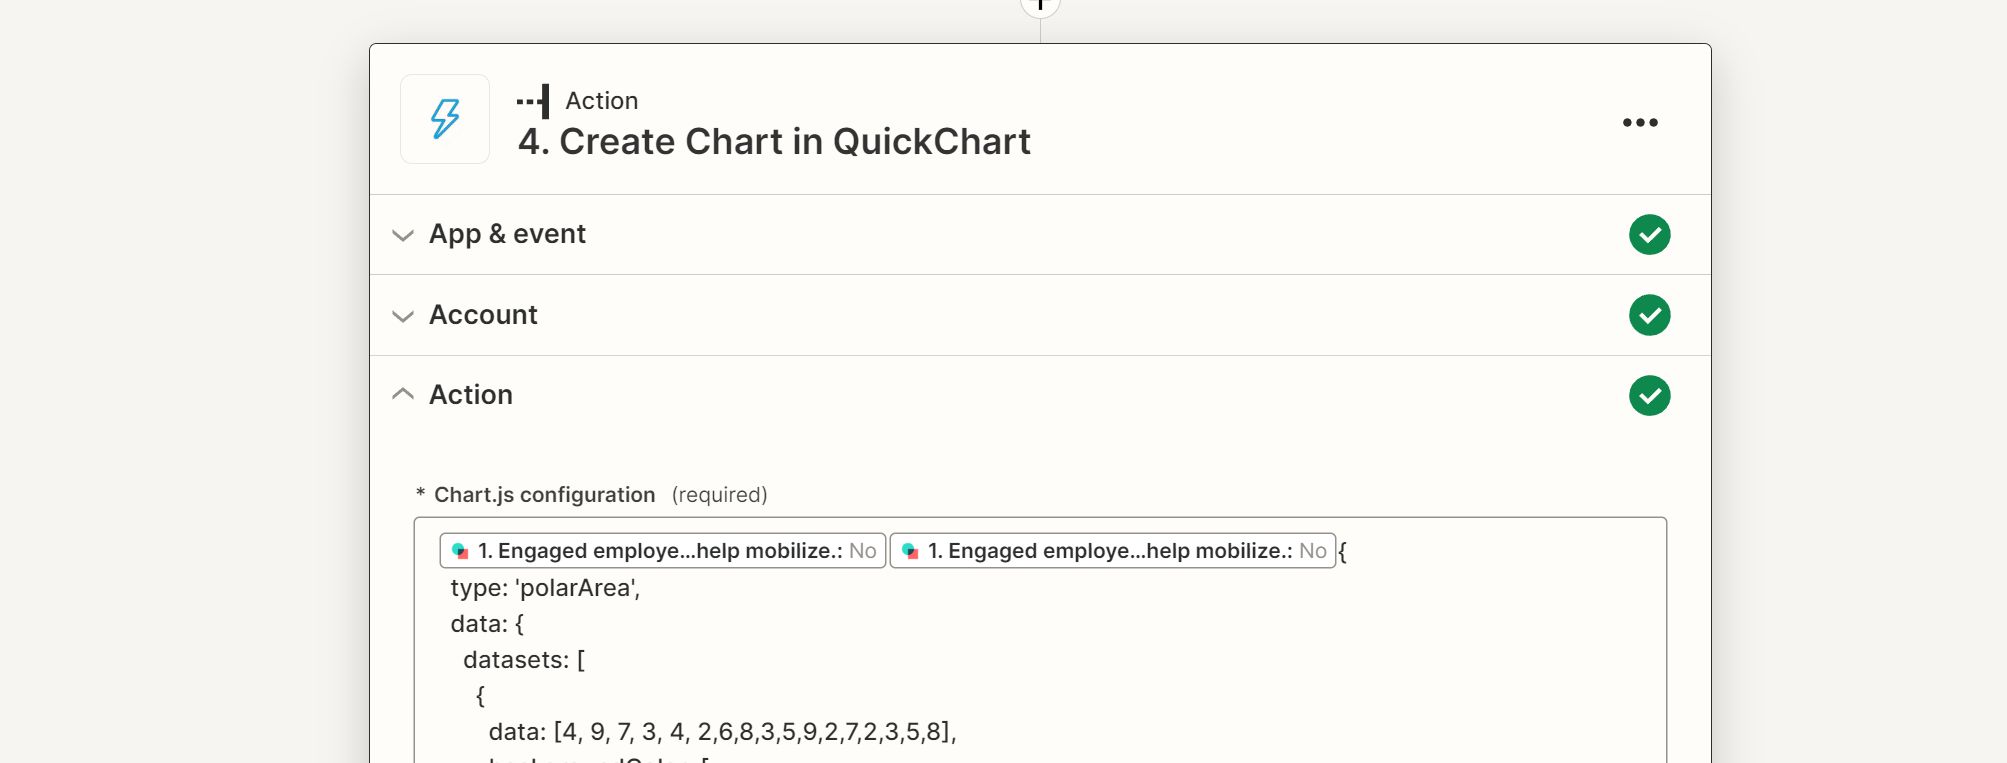
If that’s the case, in the Create Chart action it looks as though a list of data values ([4, 9, 7, 3, 4, 2...etc]) has been typed in instead of being selected from the involve.me trigger. So if the points are being assigned by that Run Javascript Code action, then you’d want to select the points values it outputs for those manually typed data values instead.
And looking at the documentation for Chart.js it seems like the labels are missing from the code in the Chart.js configuration field. It appears that it’s expecting to receive a list of the labels above the datasets section, for example:
So you’d need to update the code in the Chart.js configuration field to include the relevant label names.
If that’s not the case, please can you share a screenshot of the fields as they appear within the Test section of the Involve.me trigger step (step 1 of the Zap)? For example, if the trigger was Google Sheets the screenshot would look something like this:
Thanks for your assistance here, we’ll be keeping an eye out for your reply!
Enter your username or e-mail address. We'll send you an e-mail with instructions to reset your password.